
Win probability changed during the game. · 3 February 2025
It was more exciting than 96% of NBA games since 2017
- · The win probability swung between the two teams 24 times
- · It stayed close for almost the whole game
It measures how much the win probability moved during the game —without looking at who won or at the score— and compares it with the 10,950 NBA games with a curve since 2017. “Highly recommended” is the most intense 20%, “recommended” runs from 50% to 80%, and “skippable” is the rest. Source: ESPN.
Home team's win probability across the game (source: ESPN). The band rises when DET leads and falls when ATL does.
Rotations · who was on the floor
Closing lineup · ATL

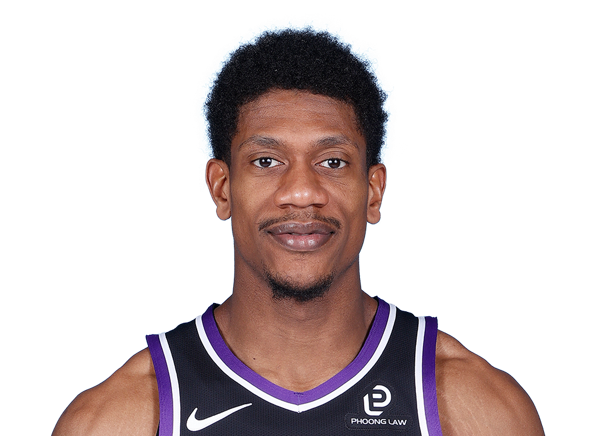

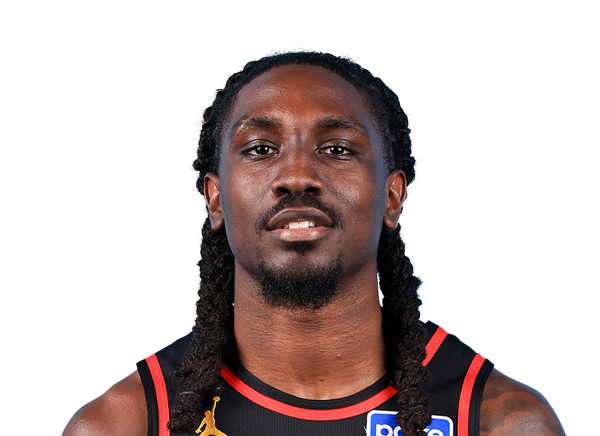

Daniels · Hunter · Okongwu · Wallace · Krejci
Closing lineup · DET
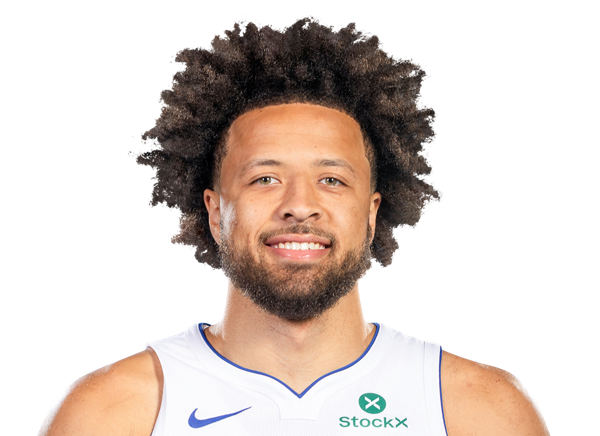
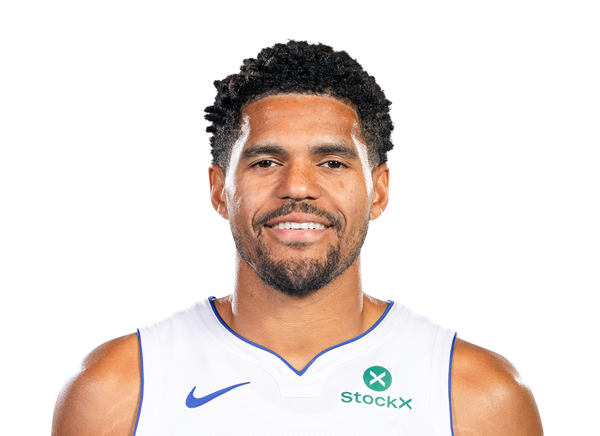

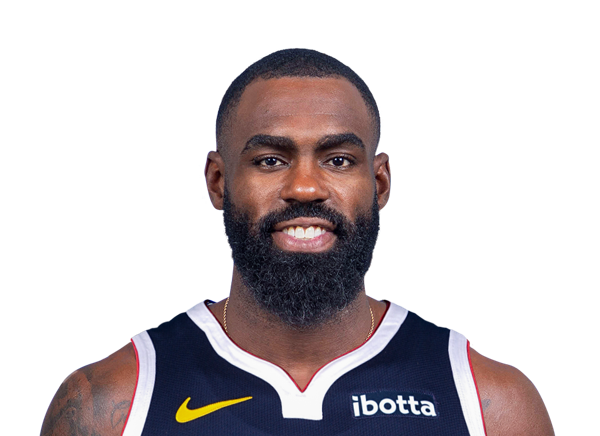

Cunningham · Harris · Duren · Hardaway · Beasley
Dyson Daniels
36′ · -9
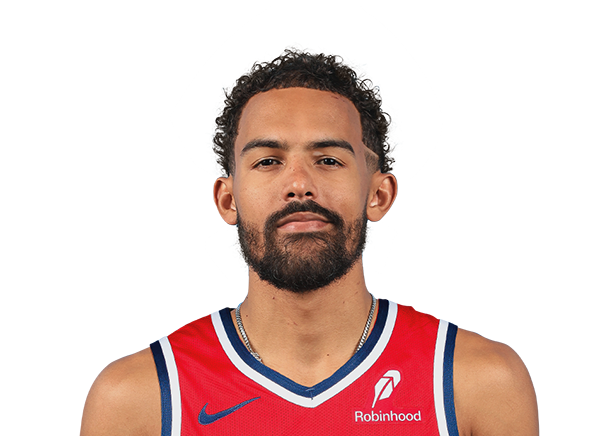
Trae Young
35′ · -11
De'Andre Hunter
31′ · -4
Onyeka Okongwu
28′ · -10

Zaccharie Risacher
26′ · +3

Larry Nance Jr.
20′ · +12
Keaton Wallace
13′ · +13
Vit Krejci
28′ · 0

Garrison Mathews
12′ · +11
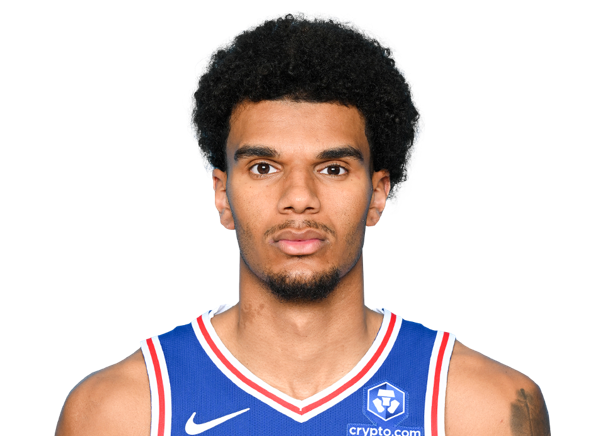
Dominick Barlow
11′ · +5
Cade Cunningham
38′ · +10
Tobias Harris
35′ · +12
Jalen Duren
29′ · +7
Tim Hardaway Jr.
27′ · +13
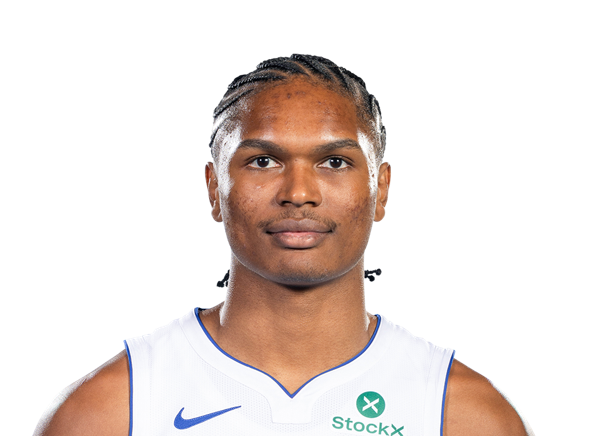
Ausar Thompson
25′ · +2
Malik Beasley
24′ · -9
Isaiah Stewart
19′ · -9
Simone Fontecchio
16′ · -11
Marcus Sasser
10′ · -12

Ronald Holland II
16′ · -13
Each bar is a stint on the floor (source: NBA). The number is minutes played and the team's +/− with him on the court. ATL and DET.
These lineups played the most minutes together.
Atlanta Hawks
Young, Hunter, Okongwu, Daniels, and Risacher played 11.1 minutes together.
Their team lost that stretch by 15 points.
Young, Hunter, Okongwu, Krejci, and Daniels played 7.5 minutes together.
Their team lost that stretch by 1 point.
Nance, Young, Mathews, Krejci, and Barlow played 6.3 minutes together.
Their team won that stretch by 3 points.
Detroit Pistons
Cunningham, Duren, Thompson, Harris, and Hardaway played 17.3 minutes together.
Their team won that stretch by 14 points.
Beasley, Cunningham, Duren, Harris, and Hardaway played 6.2 minutes together.
Their team won that stretch by 4 points.
Beasley, Stewart, Sasser, Fontecchio, and Holland played 5.4 minutes together.
Their team lost that stretch by 6 points.
▸See every lineup of the game
Atlanta Hawks
Young, Okongwu, Krejci, Daniels, and Risacher played 5.7 minutes together.
Their team tied that stretch.
Hunter, Okongwu, Daniels, Wallace, and Risacher played 3.8 minutes together.
Their team won that stretch by 8 points.
Nance, Mathews, Krejci, Wallace, and Barlow played 2.9 minutes together.
Their team lost that stretch by 1 point.
Nance, Hunter, Krejci, Daniels, and Wallace played 2.6 minutes together.
Their team lost that stretch by 1 point.
Nance, Young, Hunter, Mathews, and Risacher played 2.4 minutes together.
Their team won that stretch by 9 points.
Nance, Krejci, Daniels, Wallace, and Barlow played 2.1 minutes together.
Their team won that stretch by 3 points.
Nance, Hunter, Daniels, Wallace, and Risacher played 1.2 minutes together.
Their team won that stretch by 5 points.
Nance, Young, Hunter, Daniels, and Risacher played 1.2 minutes together.
Their team lost that stretch by 5 points.
Detroit Pistons
Beasley, Stewart, Cunningham, Fontecchio, and Holland played 4.1 minutes together.
Their team lost that stretch by 5 points.
Stewart, Cunningham, Fontecchio, Thompson, and Holland played 3.1 minutes together.
Their team lost that stretch by 3 points.
Duren, Sasser, Thompson, Harris, and Hardaway played 2.9 minutes together.
Their team lost that stretch by 4 points.
Beasley, Stewart, Cunningham, Holland, and Harris played 2.8 minutes together.
Their team won that stretch by 5 points.
Beasley, Stewart, Cunningham, Fontecchio, and Harris played 2.2 minutes together.
Their team won that stretch by 3 points.
Beasley, Cunningham, Duren, Thompson, and Harris played 1.9 minutes together.
Their team lost that stretch by 5 points.
Beasley, Stewart, Sasser, Fontecchio, and Harris played 1.3 minutes together.
Their team tied that stretch.
▸See where these figures come from
The lineups come from the NBA's official rotation: who was on the floor and when. Each lineup's plus-minus is worked out from every player's stints and is only shown when they all add up with each other and with the final score.
Game context
Official NBA L2M report: every call in the endgame, reviewed by the league.