
Win probability changed during the game. · 5 June 2025
It was more exciting than 54% of NBA games since 2017
It measures how much the win probability moved during the game —without looking at who won or at the score— and compares it with the 10,950 NBA games with a curve since 2017. “Highly recommended” is the most intense 20%, “recommended” runs from 50% to 80%, and “skippable” is the rest. Source: ESPN.
Home team's win probability across the game (source: ESPN). The band rises when OKC leads and falls when IND does.
Rotations · who was on the floor
Closing lineup · IND



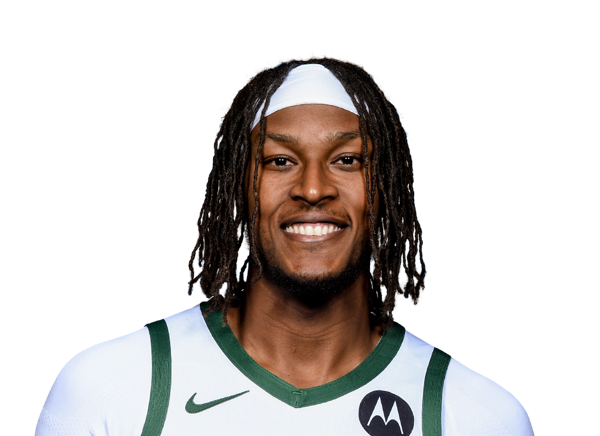
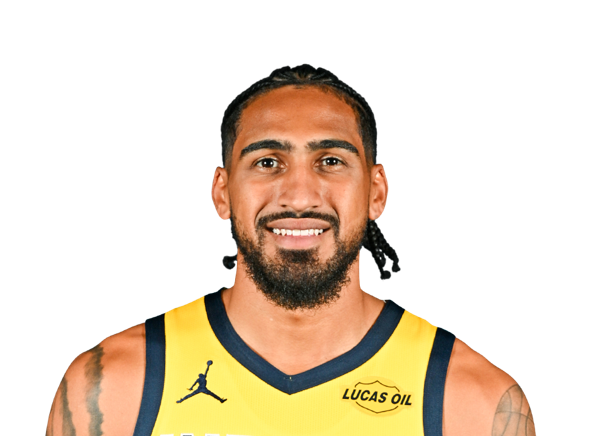
Siakam · Nembhard · Nesmith · Turner · Toppin
Closing lineup · OKC
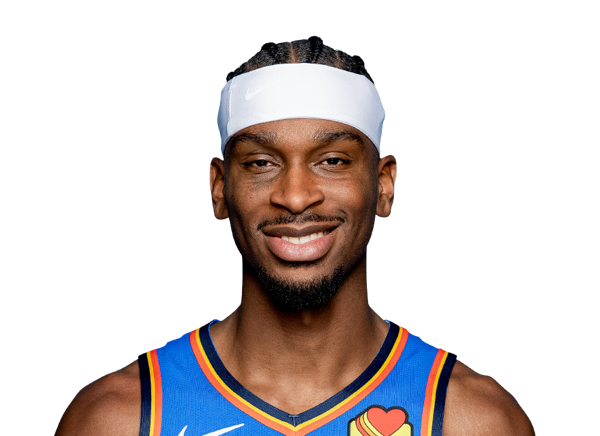
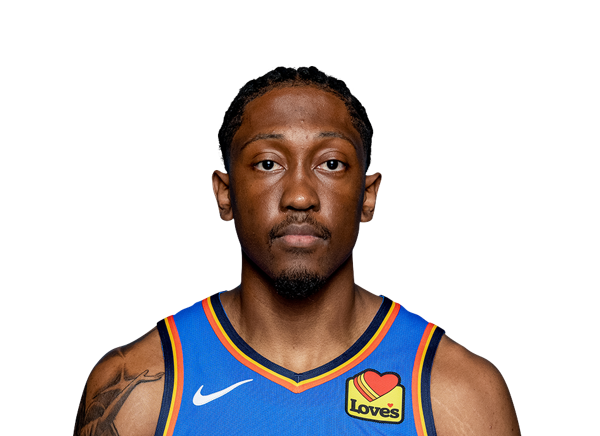
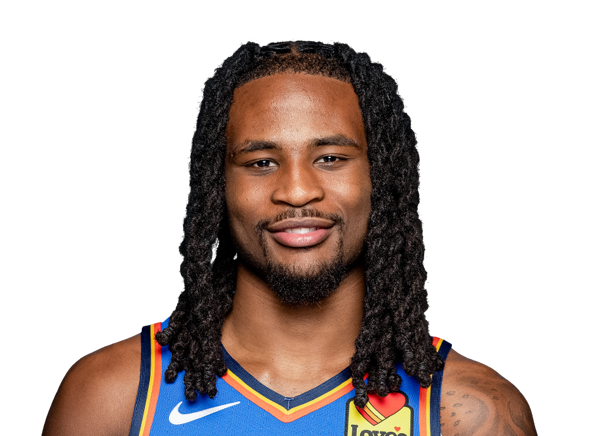
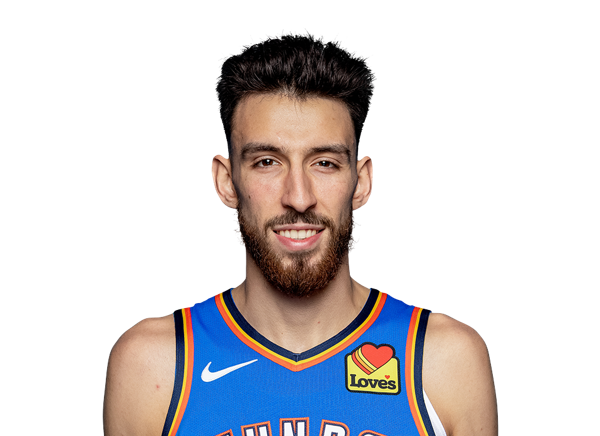

Gilgeous-Alexander · Williams · Wallace · Holmgren · Caruso
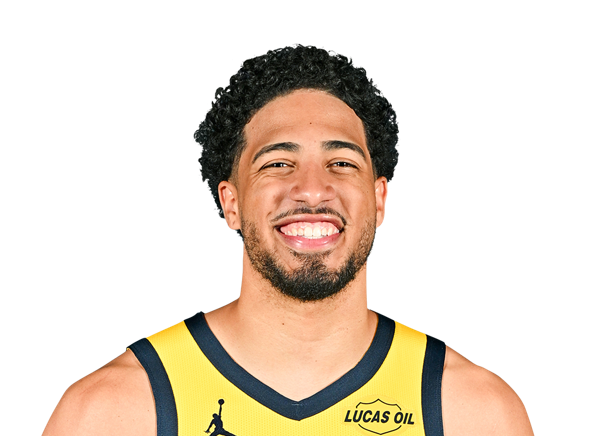
Tyrese Haliburton
39′ · +12
Pascal Siakam
35′ · -10
Andrew Nembhard
32′ · +11
Aaron Nesmith
31′ · +13
Myles Turner
28′ · +8
Obi Toppin
25′ · +13
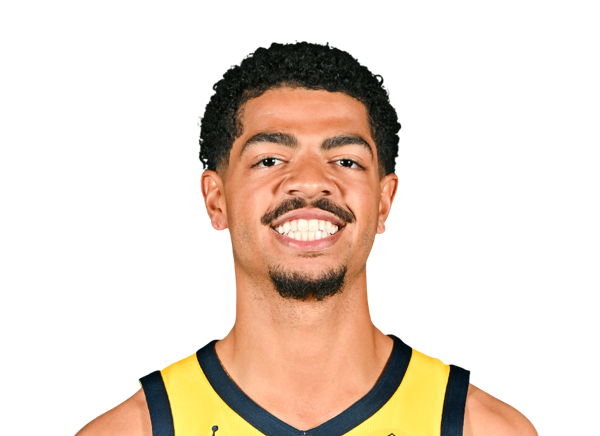
Ben Sheppard
9′ · -12

T.J. McConnell
17′ · -13
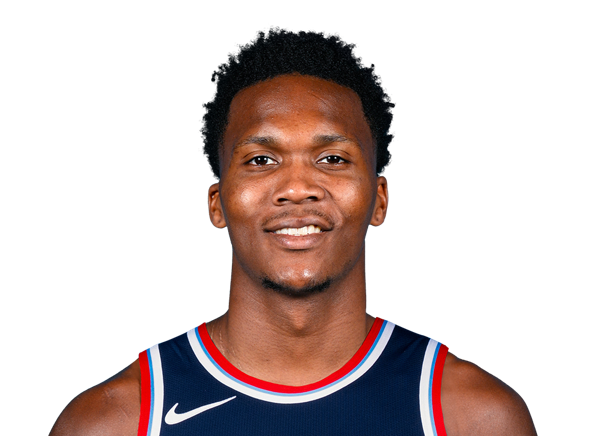
Bennedict Mathurin
16′ · -8
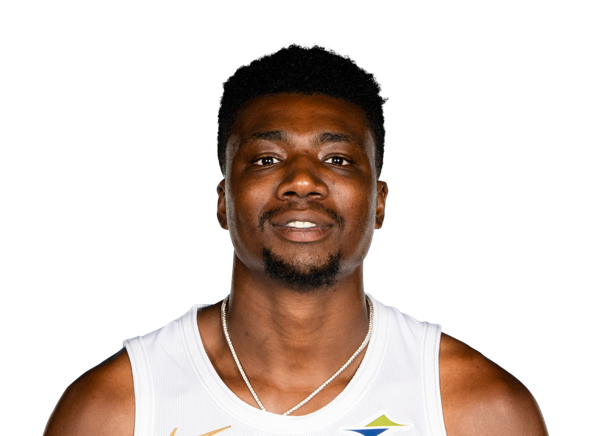
Thomas Bryant
8′ · -9
Shai Gilgeous-Alexander
40′ · +3
Jalen Williams
36′ · -4

Luguentz Dort
36′ · -3
Cason Wallace
33′ · -13
Chet Holmgren
24′ · +4
Alex Caruso
28′ · +2

Isaiah Hartenstein
17′ · +2
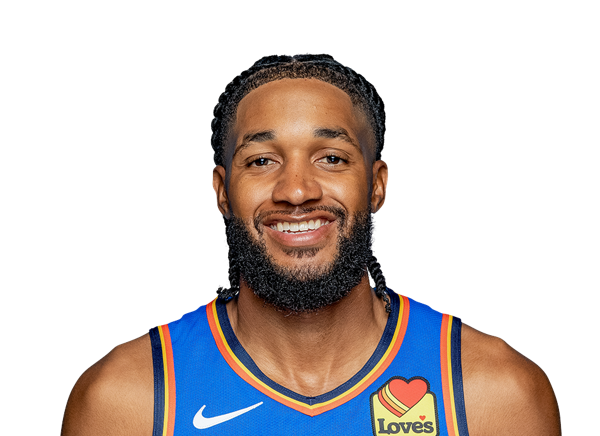
Isaiah Joe
11′ · +3
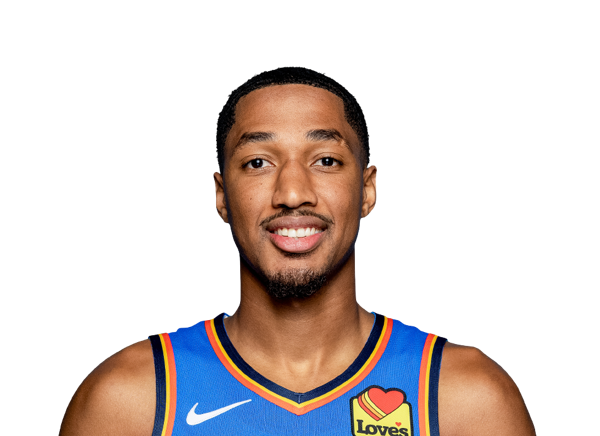
Aaron Wiggins
9′ · +6
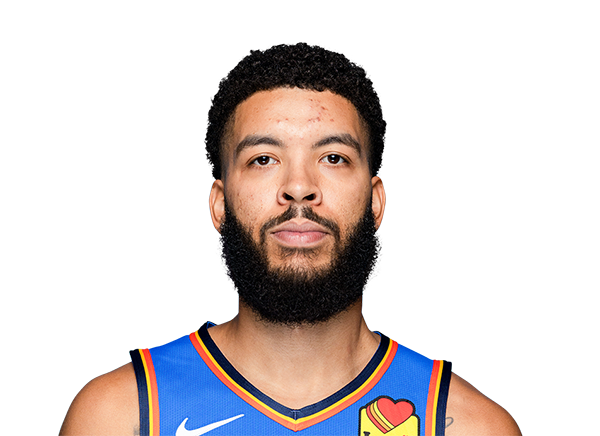
Kenrich Williams
1′ · -2
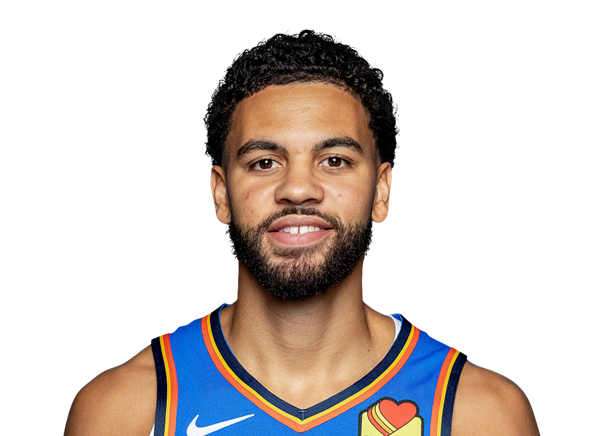
Ajay Mitchell
4′ · -3
Each bar is a stint on the floor (source: NBA). The number is minutes played and the team's +/− with him on the court. IND and OKC.
These lineups played the most minutes together.
Indiana Pacers
Turner, Siakam, Nembhard, Haliburton, and Nesmith played 13.7 minutes together.
Their team lost that stretch by 2 points.
Turner, Nembhard, Toppin, Haliburton, and Nesmith played 6.9 minutes together.
Their team won that stretch by 14 points.
Siakam, Toppin, Haliburton, Nesmith, and McConnell played 5.3 minutes together.
Their team lost that stretch by 4 points.
Oklahoma City Thunder
Gilgeous-Alexander, Dort, Holmgren, Williams, and Wallace played 16.4 minutes together.
Their team won that stretch by 2 points.
Caruso, Gilgeous-Alexander, Dort, Williams, and Wallace played 7.0 minutes together.
Their team lost that stretch by 7 points.
Caruso, Hartenstein, Gilgeous-Alexander, Dort, and Joe played 5.4 minutes together.
Their team won that stretch by 2 points.
▸See every lineup of the game
Indiana Pacers
Siakam, Bryant, Mathurin, Sheppard, and McConnell played 3.7 minutes together.
Their team lost that stretch by 6 points.
Siakam, Nembhard, Toppin, Haliburton, and Nesmith played 3.6 minutes together.
Their team won that stretch by 5 points.
Turner, Nembhard, Toppin, Haliburton, and Mathurin played 2.7 minutes together.
Their team won that stretch by 1 point.
Turner, Nembhard, Toppin, Haliburton, and Sheppard played 2.1 minutes together.
Their team lost that stretch by 4 points.
Siakam, Toppin, Mathurin, Sheppard, and McConnell played 2.0 minutes together.
Their team lost that stretch by 1 point.
Siakam, Bryant, Haliburton, Mathurin, and McConnell played 1.6 minutes together.
Their team won that stretch by 2 points.
Siakam, Bryant, Nembhard, Mathurin, and McConnell played 1.4 minutes together.
Their team lost that stretch by 5 points.
Bryant, Nembhard, Toppin, Haliburton, and Mathurin played 1.4 minutes together.
Their team tied that stretch.
Turner, Siakam, Mathurin, Sheppard, and McConnell played 1.3 minutes together.
Their team lost that stretch by 1 point.
Siakam, Toppin, Haliburton, Nesmith, and Mathurin played 1.2 minutes together.
Their team tied that stretch.
Oklahoma City Thunder
Caruso, Hartenstein, Wiggins, Williams, and Wallace played 4.3 minutes together.
Their team lost that stretch by 1 point.
Caruso, Gilgeous-Alexander, Dort, Holmgren, and Williams played 3.0 minutes together.
Their team won that stretch by 5 points.
Caruso, Hartenstein, Wiggins, Williams, and Mitchell played 2.9 minutes together.
Their team tied that stretch.
Gilgeous-Alexander, Dort, Joe, Holmgren, and Wallace played 2.2 minutes together.
Their team tied that stretch.
Caruso, Hartenstein, Gilgeous-Alexander, Joe, and Wiggins played 1.9 minutes together.
Their team won that stretch by 5 points.
Caruso, Hartenstein, Gilgeous-Alexander, Joe, and Wallace played 1.5 minutes together.
Their team lost that stretch by 2 points.
▸See where these figures come from
The lineups come from the NBA's official rotation: who was on the floor and when. Each lineup's plus-minus is worked out from every player's stints and is only shown when they all add up with each other and with the final score.