
Win probability changed during the game. · 21 February 2026
It was more exciting than 99% of NBA games since 2017
- · It was still open in the final minutes
- · The win probability swung between the two teams 31 times
It measures how much the win probability moved during the game —without looking at who won or at the score— and compares it with the 10,950 NBA games with a curve since 2017. “Highly recommended” is the most intense 20%, “recommended” runs from 50% to 80%, and “skippable” is the rest. Source: ESPN.
Home team's win probability across the game (source: ESPN). The band rises when PHX leads and falls when ORL does.
Rotations · who was on the floor
Closing lineup · ORL
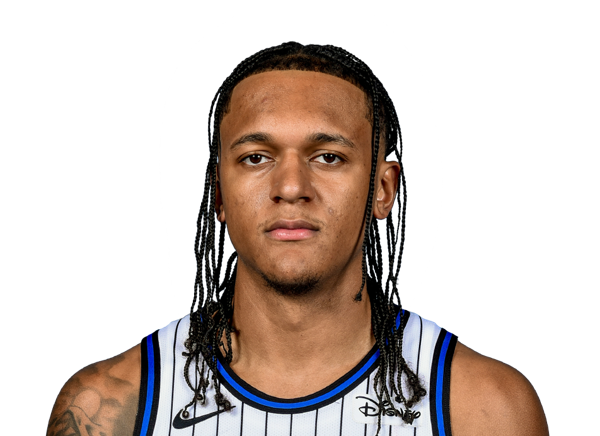
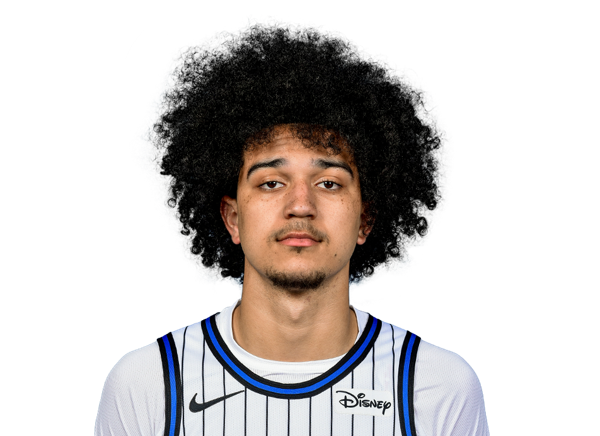
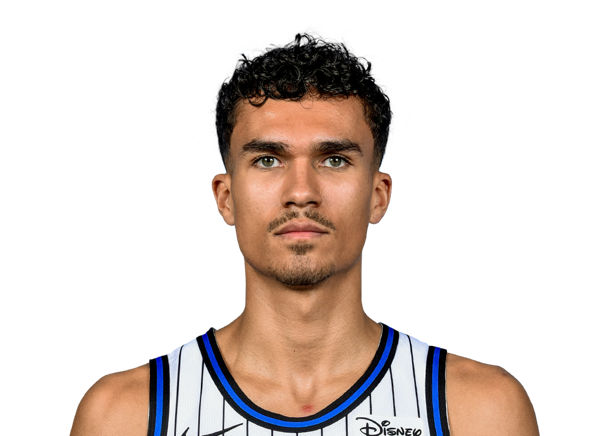
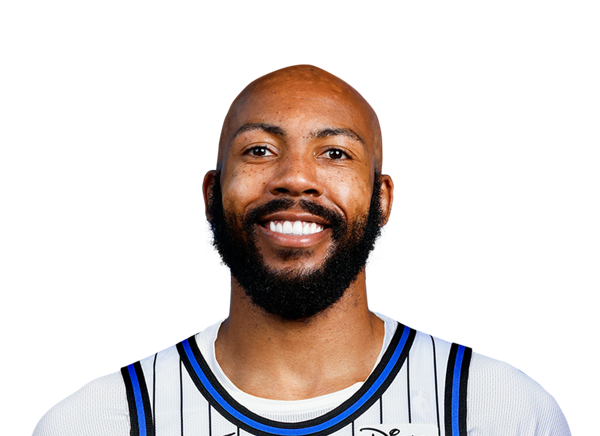
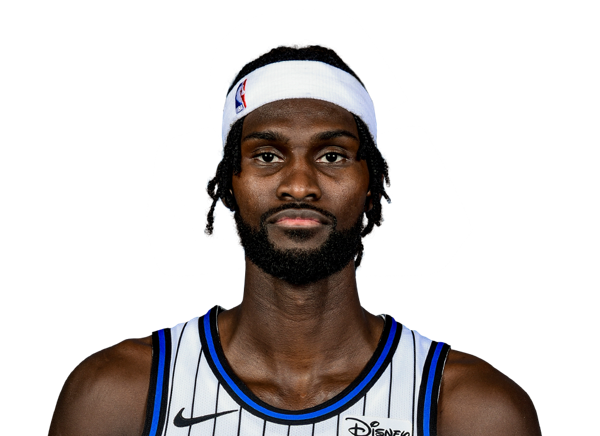
Banchero · Black · da Silva · Carter · Isaac
Closing lineup · PHX
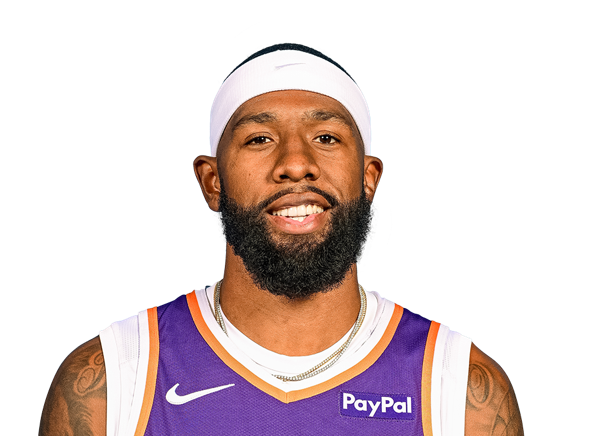
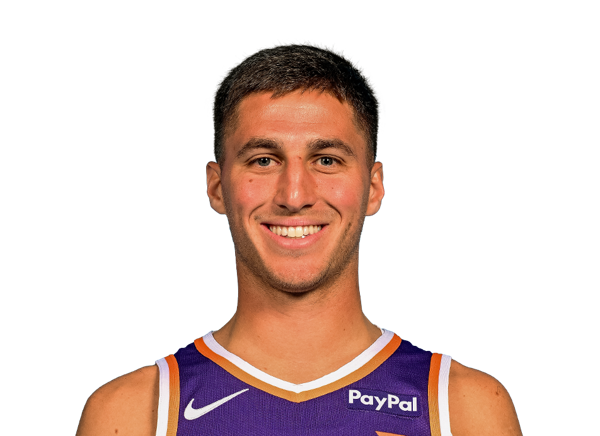
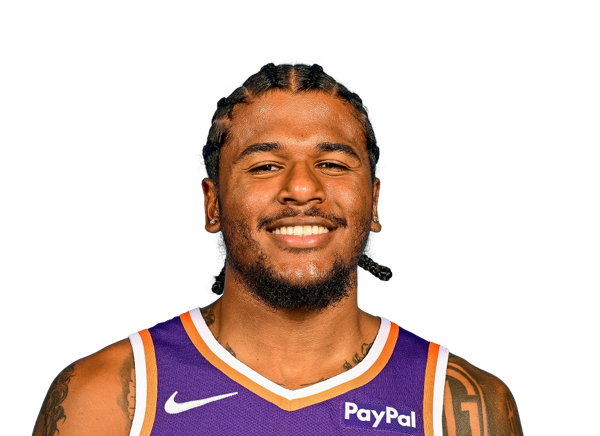

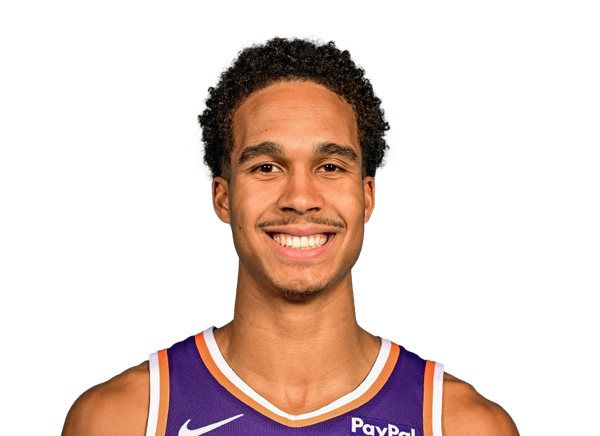
O'Neale · Gillespie · Green · Allen · Ighodaro
Paolo Banchero
47′ · +10
Anthony Black
45′ · +8
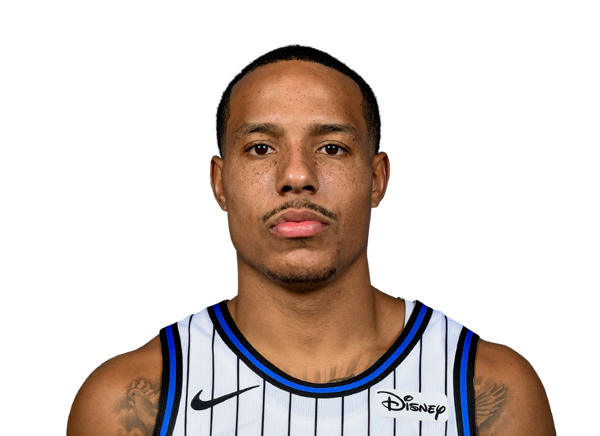
Desmond Bane
40′ · -7
Tristan da Silva
38′ · +13
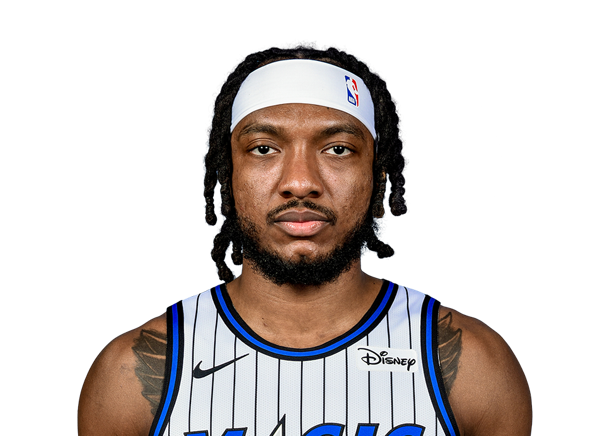
Wendell Carter Jr.
34′ · +19
Jevon Carter
33′ · -9
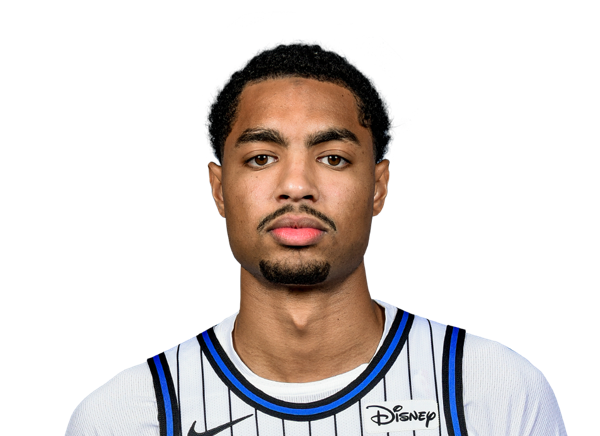
Jett Howard
19′ · -11
Moritz Wagner
12′ · -11
Jonathan Isaac
8′ · -8
Goga Bitadze
9′ · -9
Noah Penda
6′ · -10
Royce O'Neale
46′ · -6
Collin Gillespie
45′ · +8
Jalen Green
37′ · 0
Mark Williams
28′ · -8
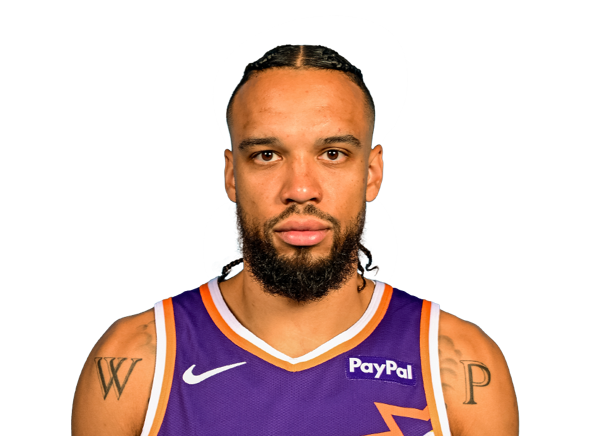
Dillon Brooks
7′ · -8
Grayson Allen
33′ · 0
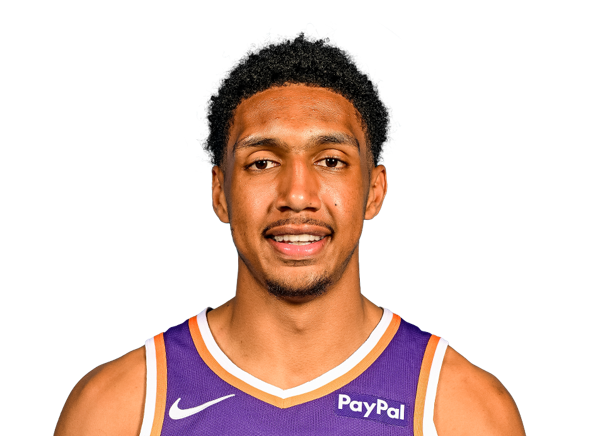
Ryan Dunn
22′ · +16
Oso Ighodaro
30′ · +11
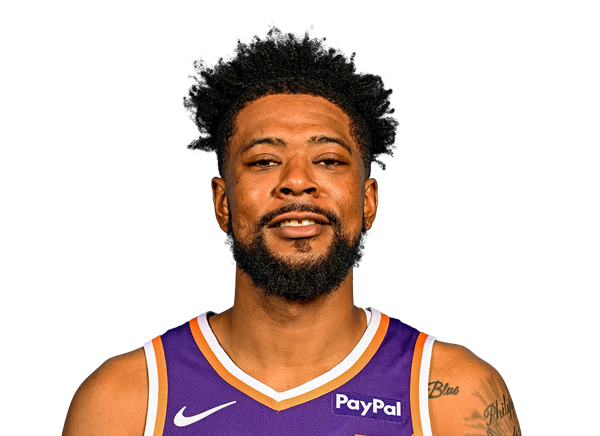
Jordan Goodwin
25′ · +6
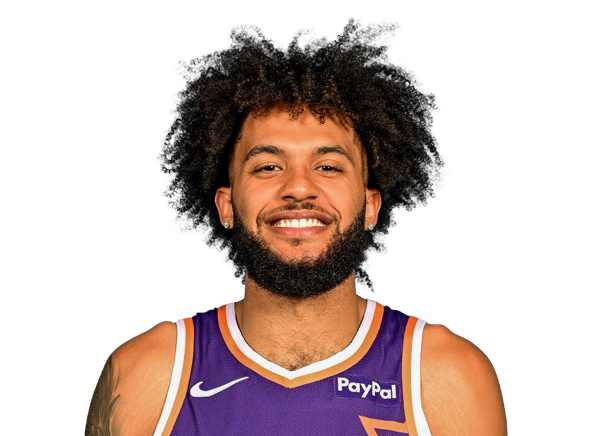
Isaiah Livers
15′ · -6

Jamaree Bouyea
2′ · +2
Each bar is a stint on the floor (source: NBA). The number is minutes played and the team's +/− with him on the court. ORL and PHX.
These lineups played the most minutes together.
Orlando Magic
Carter, Bane, Banchero, Black, and da Silva played 19.4 minutes together.
Their team won that stretch by 15 points.
Carter, Carter, Banchero, Black, and da Silva played 10.1 minutes together.
Their team won that stretch by 7 points.
Isaac, Carter, Wagner, Bane, and Howard played 5.5 minutes together.
Their team lost that stretch by 3 points.
Phoenix Suns
O'Neale, Allen, Green, Williams, and Gillespie played 7.7 minutes together.
Their team lost that stretch by 1 point.
O'Neale, Allen, Green, Gillespie, and Ighodaro played 6.1 minutes together.
Their team lost that stretch by 1 point.
O'Neale, Green, Williams, Gillespie, and Dunn played 5.9 minutes together.
Their team won that stretch by 13 points.
▸See every lineup of the game
Orlando Magic
Bitadze, Bane, Banchero, Black, and da Silva played 5.5 minutes together.
Their team lost that stretch by 9 points.
Carter, Wagner, Bane, Howard, and Penda played 4.0 minutes together.
Their team lost that stretch by 5 points.
Isaac, Carter, Banchero, Black, and da Silva played 2.6 minutes together.
Their team lost that stretch by 3 points.
Carter, Bitadze, Black, Howard, and Penda played 2.0 minutes together.
Their team lost that stretch by 5 points.
Carter, Carter, Bane, Banchero, and Howard played 1.9 minutes together.
Their team lost that stretch by 3 points.
Carter, Wagner, Bane, Banchero, and Howard played 1.8 minutes together.
Their team tied that stretch.
Carter, Carter, Bane, Banchero, and Black played 1.5 minutes together.
Their team tied that stretch.
Carter, Carter, Banchero, Black, and Howard played 1.4 minutes together.
Their team tied that stretch.
Carter, Bitadze, Banchero, Black, and Howard played 1.3 minutes together.
Their team won that stretch by 5 points.
Phoenix Suns
O'Neale, Brooks, Green, Williams, and Gillespie played 5.2 minutes together.
Their team lost that stretch by 10 points.
O'Neale, Goodwin, Gillespie, Ighodaro, and Dunn played 4.2 minutes together.
Their team lost that stretch by 3 points.
O'Neale, Allen, Livers, Goodwin, and Ighodaro played 3.3 minutes together.
Their team tied that stretch.
Allen, Goodwin, Gillespie, Ighodaro, and Dunn played 3.1 minutes together.
Their team won that stretch by 4 points.
O'Neale, Green, Livers, Gillespie, and Ighodaro played 2.7 minutes together.
Their team lost that stretch by 1 point.
Livers, Goodwin, Gillespie, Ighodaro, and Dunn played 2.5 minutes together.
Their team won that stretch by 4 points.
Allen, Goodwin, Bouyea, Ighodaro, and Dunn played 2.3 minutes together.
Their team won that stretch by 2 points.
O'Neale, Green, Goodwin, Gillespie, and Ighodaro played 2.2 minutes together.
Their team won that stretch by 3 points.
O'Neale, Green, Livers, Williams, and Gillespie played 2.1 minutes together.
Their team lost that stretch by 3 points.
Brooks, Allen, Green, Williams, and Dunn played 2.1 minutes together.
Their team won that stretch by 2 points.
O'Neale, Allen, Livers, Goodwin, and Williams played 1.8 minutes together.
Their team lost that stretch by 3 points.
O'Neale, Allen, Goodwin, Gillespie, and Ighodaro played 1.7 minutes together.
Their team won that stretch by 2 points.
O'Neale, Allen, Green, Goodwin, and Williams played 1.5 minutes together.
Their team tied that stretch.
Allen, Livers, Goodwin, Gillespie, and Ighodaro played 1.4 minutes together.
Their team won that stretch by 1 point.
O'Neale, Allen, Green, Williams, and Dunn played 1.4 minutes together.
Their team lost that stretch by 2 points.
▸See where these figures come from
The lineups come from the NBA's official rotation: who was on the floor and when. Each lineup's plus-minus is worked out from every player's stints and is only shown when they all add up with each other and with the final score.