
Professional DNA
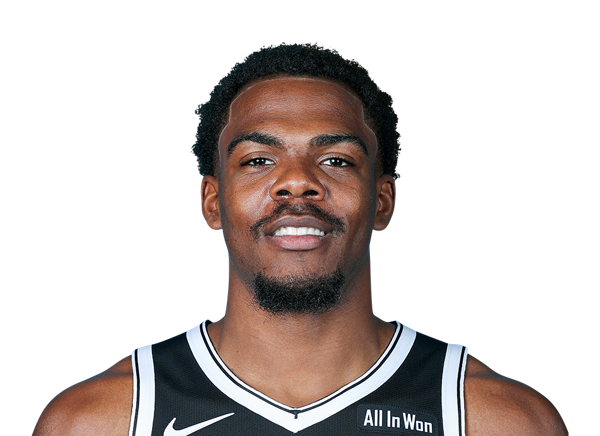
Day'Ron Sharpe: PROFILE NOT COMPLETE YET
Rebounding · 2025-26 · 62 games

88
percentil
The question
What kind of player is Day'Ron Sharpe?
The evidence
Day'Ron Sharpe · Rebounding: 88th percentile (6.7 rebounds per game)
Day'Ron Sharpe: what moved most is Playmaking
The read
What they are, the role they held and what sets them apart. Every line comes from a figure further down this same page.
- What they arePROFILE NOT COMPLETE YET
- RoleShort rotation: 18.7 minutes per game across 62 games
- What sets them apartRebounding · 88th percentile
6.7 rebounds per game
The axes, one by one
Every axis with its percentile against 452 players with a sample in 2025-26. An axis without enough sample says «no data» and is not filled in.
- Scoring50th percentile
8.7 points per game
- Playmaking61th percentile
2.3 assists per game
- Outside shootingno data
23.1 % from three · 39 attempts
- Defensive impact76th percentile
DBPM 0.9: defensive impact per 100 possessions compared with an average player
- Finishing at the rim82th percentile
73.1 % · 223 attempts
- Rebounding88th percentile
6.7 rebounds per game
Strengths
- Rebounding88th percentile
Very high · 6.7 rebounds per game
- Finishing at the rim82th percentile
Very high · 73.1 % · 223 attempts
- Defensive impact76th percentile
Very high · DBPM 0.9: defensive impact per 100 possessions compared with an average player
Limitations
No measured axis falls below his league's median. What follows are the limits of the read, not weak spots in the player.
- Availability62/82
missed 20 of his team's games in 2025-26
- Axes without enough sample
Outside shooting
Recent change
Scoring: 31th percentile → 50th percentile (+19) · Playmaking: 7th percentile → 61th percentile (+54) · Rebounding: 73th percentile → 88th percentile (+15)
- 2021-227th percentile
32 games · 12.2 minutes per game
- Scoring
- 31th percentile
- Playmaking
- 7th percentile
- Rebounding
- 73th percentile
- 2022-2315th percentile
48 games · 11.5 minutes per game
- Scoring
- 20th percentile
- Playmaking
- 15th percentile
- Rebounding
- 64th percentile
- 2023-2443th percentile
61 games · 15.1 minutes per game
- Scoring
- 41th percentile
- Playmaking
- 43th percentile
- Rebounding
- 86th percentile
- 2024-2550th percentile
50 games · 18.1 minutes per game
- Scoring
- 44th percentile
- Playmaking
- 50th percentile
- Rebounding
- 88th percentile
- 2025-2661th percentile
62 games · 18.7 minutes per game
- Scoring
- 50th percentile
- Playmaking
- 61th percentile
- Rebounding
- 88th percentile
Context
2025-26 · 62 games · 18.7 minutes per game · Percentile against 452 measured players in 2025-26 · SportiveWorld own data
FactDerivedAssumption
What this does not prove
- Percentiles compare inside the NBA. Outside it they do not mean the same thing.
- It portrays the 2025-26 season, already closed. It is not what comes next.
- This DNA profile does not include movement or touch data.
From here
Where it comes from
Source
not stated
Model input
not stated
Computation
not stated
This answer
2026-10-13
Where this comes from