
Forecast NBA 2026-27Brooklyn Nets
● Updated · 7 Nov
Brooklyn rises from 20 to 27 wins.

Julius Randle
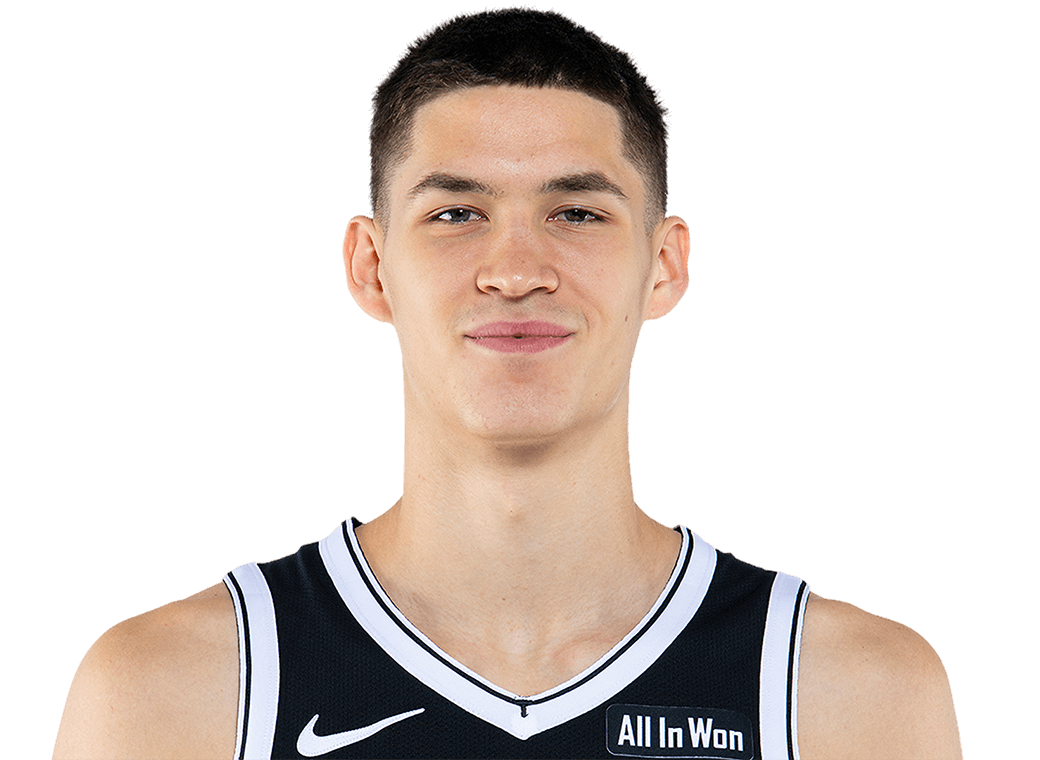
Josh Minott is the player who weighs most in this projection: +2.0 projected impact.
The players contributing the most projected impact to this roster. Impact is on its real scale, not a 0-99 score.



How the minutes are allocated
Roster used by the projection · 2026-27 · 7 Nov
| Player | Min/game | Expected games | Season minutes |
|---|---|---|---|
| Julius Randle | 28.2 | 74.0 | 2,072 |
| Michael Porter Jr. | 27.8 | 71.9 | 1,989 |
| Noah Clowney | 23.7 | 71.0 | 1,668 |
| Nolan Traore | 19.8 | 70.3 | 1,385 |
| Egor Demin | 22.2 | 60.5 | 1,336 |
| Day'Ron Sharpe | 19.1 | 68.7 | 1,300 |
| Keon Ellis | 17.7 | 71.9 | 1,266 |
| Chaney Johnson | 18.0 | 59.5 | 1,062 |
| Mikel Brown Jr. | 20.0 | 53.2 | 1,056 |
| Terance Mann | 18.7 | 44.6 | 827 |
| Danny Wolf | 18.6 | 44.2 | 815 |
| Josh Minott | 17.4 | 45.0 | 776 |
| Drake Powell | 18.1 | 40.8 | 733 |
| Moritz Wagner | 11.9 | 60.8 | 721 |
| Ben Saraf | 17.1 | 31.2 | 531 |
| Joshua Jefferson | 12.5 | 27.6 | 344 |
| Tyler Bilodeau | 11.5 | 11.0 | 127 |
| Armoni Brooks | 11.2 | 5.9 | 65 |
| Grant Nelson | 9.7 | 6.1 | 59 |
- Allocated minutes
- 18,132
- Not assigned to players
- 1,548
- Team budget
- 19,680
Minutes per game are conditional on playing. Season minutes include expected participation and an overtime adjustment; the entire roster's minutes per game do not have to add up to 240.
The availability model is under review: it uses the probability of appearing at the start and does not yet include all late returns. This table shows the published reference, not a recalibration.
Where the allocation comes from
| Player | Probability of an opening appearance | Games conditional on an opening appearance | Minutes method |
|---|---|---|---|
| Julius Randle | 100.0 % | 74.0 | History and team context |
| Michael Porter Jr. | 100.0 % | 71.9 | History and team context |
| Noah Clowney | 100.0 % | 71.0 | History and team context |
| Nolan Traore | 100.0 % | 70.3 | History and team context |
| Egor Demin | 100.0 % | 60.5 | History and team context |
| Day'Ron Sharpe | 100.0 % | 68.7 | History and team context |
| Keon Ellis | 100.0 % | 71.9 | History and team context |
| Chaney Johnson | 100.0 % | 59.5 | History and team context |
| Mikel Brown Jr. | 100.0 % | 53.2 | Historical average by draft band |
| Terance Mann | 100.0 % | 44.6 | History and team context |
| Danny Wolf | 100.0 % | 44.2 | History and team context |
| Josh Minott | 100.0 % | 45.0 | History and team context |
| Drake Powell | 100.0 % | 40.8 | History and team context |
| Moritz Wagner | 100.0 % | 60.8 | History and team context |
| Ben Saraf | 100.0 % | 31.2 | History and team context |
| Joshua Jefferson | 100.0 % | 27.6 | Historical average by draft band |
| Tyler Bilodeau | 50.4 % | 21.9 | Historical average by draft band |
| Armoni Brooks | 14.0 % | 41.8 | History and team context |
| Grant Nelson | 24.8 % | 24.5 | History and team context |
Since the first version, on 14 Aug, the projection has moved from 28.5 to 27.3 wins.
See every version
- 14 Aug28.5 wins
- 21 Aug-0.40 · trigger not stated28.1 wins
- 22 Aug0.00 · roster change28.1 wins
- 24 Aug-4.03 · roster change24.1 wins
- 25 Aug0.00 · roster change24.1 wins
- 26 Aug0.00 · roster change24.1 wins
- 27 Aug+0.81 · roster change24.9 wins
- 28 Aug+4.24 · roster change29.1 wins
- 29 Aug+0.01 · roster change29.1 wins
- 30 Aug-0.02 · roster change29.1 wins
- 31 Aug-4.95 · roster change24.1 wins
- 1 Sept+3.94 · roster change28.1 wins
- 2 Sept-0.01 · roster change28.1 wins
- 3 Sept0.00 · roster change28.1 wins
- 4 Sept+0.02 · roster change28.1 wins
- 6 Sept0.00 · roster change28.1 wins
- 8 Sept0.00 · roster change28.1 wins
- 9 Sept0.00 · roster change28.1 wins
- 10 Sept0.00 · roster change28.1 wins
- 11 Sept0.00 · roster change28.1 wins
- 12 Sept-0.02 · roster change28.1 wins
- 14 Sept-0.13 · roster change27.9 wins
- 15 Sept0.00 · roster change27.9 wins
- 16 Sept+0.03 · roster change28.0 wins
- 17 Sept0.00 · roster change28.0 wins
- 18 Sept0.00 · roster change28.0 wins
- 19 Sept0.00 · roster change28.0 wins
- 20 Sept0.00 · roster change28.0 wins
- 24 Sept+0.06 · trigger not stated28.0 wins
- 25 Sept+0.02 · roster change28.1 wins
- 26 Sept+0.01 · roster change28.1 wins
- 27 Sept-0.02 · roster change28.1 wins
- 28 Sept+0.06 · roster change28.1 wins
- 29 Sept+0.65 · roster change28.8 wins
- 30 Sept+0.01 · roster change28.8 wins
- 1 Oct-0.63 · roster change28.1 wins
- 2 Oct+0.27 · roster change28.4 wins
- 3 Oct-0.25 · roster change28.2 wins
- 4 Oct0.00 · roster change28.2 wins
- 5 Oct+0.64 · roster change28.8 wins
- 6 Oct0.00 · roster change28.8 wins
- 7 Oct0.00 · roster change28.8 wins
- 8 Oct+0.02 · roster change28.8 wins
- 9 Oct+0.01 · roster change28.8 wins
- 11 Oct+0.03 · roster change28.9 wins
- 12 Oct0.00 · roster change28.9 wins
- 13 Oct0.00 · trigger not stated28.9 wins
- 14 Oct-0.05 · roster change28.8 wins
- 15 Oct-0.01 · roster change28.8 wins
- 16 Oct0.00 · roster change28.8 wins
- 17 Oct-0.01 · roster change28.8 wins
- 18 Oct-0.10 · roster change28.7 wins
- 19 Oct-0.37 · roster change28.3 wins
- 20 Oct0.00 · roster change28.3 wins
- 21 Oct0.00 · roster change28.3 wins
- 22 Oct+0.03 · roster change28.4 wins
- 23 Oct-1.12 · roster change27.2 wins
- 24 Oct+0.01 · roster change27.2 wins
- 25 Oct+0.12 · roster change27.4 wins
- 26 Oct+1.10 · roster change28.5 wins
- 27 Oct-4.98 · roster change23.5 wins
- 28 Oct-0.19 · roster change23.3 wins
- 29 Oct+1.85 · roster change25.1 wins
- 30 Oct-0.01 · roster change25.1 wins
- 31 Oct-0.27 · roster change24.9 wins
- 1 Nov-1.32 · roster change23.5 wins
- 2 Nov+0.89 · roster change24.4 wins
- 3 Nov+1.19 · roster change25.6 wins
- 4 Nov-0.27 · roster change25.4 wins
- 5 Nov+0.62 · roster change26.0 wins
- 6 Nov+1.26 · roster change27.2 wins
- 7 Nov+0.02 · roster change27.3 wins
This is how the model has done in other years
Brooklyn would win about 27 games; the model gives it a margin of 17 to 38 that is not yet well measured.
We tested it on seasons already played, knowing which players each team had: on average, we were off by about 7 wins per team.
The final record for the 2026-27 season is not available yet; when it ends, we will show the actual wins alongside the projected wins, without changing the forecast.
This is an estimate with the data we have: it does not read injury reports, and a trade does not count until we run it again. Every figure comes from games already played.
From here
Technical detail
Uncertainty
Nominal 80% range: 17–38. Coverage of this forecasting procedure has not yet been validated.
Coverage of this forecasting procedure has not yet been validated.
- worse: 17 · wins · Nominal 80% range
- better: 38 · wins · Nominal 80% range
How this model has performed
Measured on seasons already played, not on this one. Every figure with its window and its status.
- Nominal 80% range: — · Coverage of this forecasting procedure has not yet been validated.
- Coverage recorded on 12 August for the residual interval: coverage 81.30 % · Coverage of this forecasting procedure has not yet been validated.
- Average error in wins from the season simulation: average error 7.30 · 2019-2025 · n=210 · validated · rosters that actually played (information known after the fact)
- Average error in conference seeding: average error 2.64 · 2019-2025 · n=210 · validated · rosters that actually played (information known after the fact)
- Average error in wins from the earlier, coarser method: average error 6.93 · 2005-2025 · n=555 · experimental
The real outcome
The final record for the 2026-27 season is not available yet; when it ends, we will show the actual wins alongside the projected wins, without changing the forecast.
The question
How many games will Brooklyn Nets win in 2026-27?
What this does not prove
- Coverage of this forecasting procedure has not yet been validated.
- This is not a betting line or a market probability: it is expected wins with a range.
- It rests on today's roster. A later trade is not inside it until the model is rerun.
- The win split does not break the schedule down game by game.
The evidence
Brooklyn Nets: 27.3 projected wins in 2026-27
What has changed since the first version
Where it comes from
Confidence: low · Rights: Licensed data: viewable here; ask before redistributing.
- Source: 2026-11-07
- Model input: 2026-11-07
- Computation: 2026-11-07
- This answer: 2026-11-07
Where this comes from: Team season projection · up to date · Roster the projection consumed · up to date · Player projection · up to date · Today's rosters · up to date · Game results · closed season · its clock is the season · Measured model accuracy · closed season · its clock is the season