
Professional DNA
Kevin Martin: ROLE PLAYER
Outside shooting · 2015-16 · 55 games
73
percentil
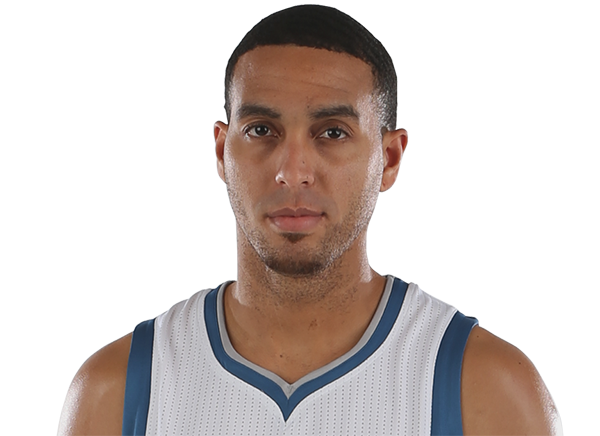
The question
What kind of player is Kevin Martin?
The evidence
Kevin Martin · Outside shooting: 73th percentile
Kevin Martin: what moved most is Scoring
The read
What they are, the role they held and what sets them apart. Every line comes from a figure further down this same page.
- What they areROLE PLAYER
- RoleShort rotation: 19.9 minutes per game across 55 games
- What sets them apartOutside shooting · 73th percentile
The axes, one by one
Every axis with its percentile against 414 players with a sample in 2015-16. An axis without enough sample says «no data» and is not filled in.
- Scoring61th percentile
9.3 points per game
- Playmaking37th percentile
1.1 assists per game
- Outside shooting73th percentile
- Defensive impact6th percentile
DBPM -1.6: defensive impact per 100 possessions compared with an average player
- Finishing at the rim8th percentile
50.0 % · 60 attempts
- Rebounding20th percentile
2.0 rebounds per game
Limitations
- Playmaking37th percentile
Low · 1.1 assists per game
- Rebounding20th percentile
Very low · 2.0 rebounds per game
- Finishing at the rim8th percentile
Very low · 50.0 % · 60 attempts
- Defensive impact6th percentile
Very low · DBPM -1.6: defensive impact per 100 possessions compared with an average player
Recent change
Scoring: 98th percentile → 61th percentile (-37) · Playmaking: 74th percentile → 37th percentile (-37) · Rebounding: 49th percentile → 20th percentile (-29)
- 2010-1198th percentile
80 games · 32.5 minutes per game
- Scoring
- 98th percentile
- Playmaking
- 74th percentile
- Rebounding
- 49th percentile
- 2011-1292th percentile
40 games · 31.6 minutes per game
- Scoring
- 92th percentile
- Playmaking
- 78th percentile
- Rebounding
- 38th percentile
- 2012-1382th percentile
77 games · 27.7 minutes per game
- Scoring
- 82th percentile
- Playmaking
- 50th percentile
- Rebounding
- 30th percentile
- 2013-1494th percentile
68 games · 32.0 minutes per game
- Scoring
- 94th percentile
- Playmaking
- 64th percentile
- Rebounding
- 46th percentile
- 2014-1595th percentile
39 games · 33.4 minutes per game
- Scoring
- 95th percentile
- Playmaking
- 70th percentile
- Rebounding
- 54th percentile
- 2015-1661th percentile
55 games · 19.9 minutes per game
- Scoring
- 61th percentile
- Playmaking
- 37th percentile
- Rebounding
- 20th percentile
Context
2015-16 · 55 games · 19.9 minutes per game · Percentile against 414 measured players in 2015-16 · SportiveWorld own data
FactDerivedAssumption
What this does not prove
- Percentiles compare inside the NBA. Outside it they do not mean the same thing.
- It portrays the 2015-16 season, already closed. It is not what comes next.
- This DNA profile does not include movement or touch data.
From here
Where it comes from
Source
not stated
Model input
not stated
Computation
not stated
This answer
2026-11-09
Where this comes from